- >>
- Healthy Adult Studies
- HCP Young Adult
- Project Protocols Detail
Components of the Human Connectome Project - Network Modeling
The Human Connectome Project will deliver brain connectivity data in unprecedented resolution and detail, across a large number of individual subjects.
These data are represented in the form of networks that describe how the various parts of the human brain are connected, via anatomical fiber bundles (structural connectivity) or via dynamic couplings during resting or task-evoked neural activity (functional connectivity). In order to realize the full potential of these connectivity data sets we are developing and applying sophisticated analysis and modeling tools to reveal the network architecture of the human brain.
Modern graph theory provides powerful quantitative tools and measures for the analysis of complex biological networks, spanning a broad range of research areas including proteomics, cellular signaling, metabolism, and epidemiology. Network analyses of brain connectivity have begun to yield important insights into brain organization of humans and nonhuman primates. Network measures are critical for creating metrics that allow the comparison of connectivity patterns across individuals, imaging modalities, as well as clinical conditions. Graph measures allow the characterization of network structure by identifying local contributions of individual nodes and connections, as well as the network’s global capacity to integrate information, or its tendency to form interconnected communities or modules.
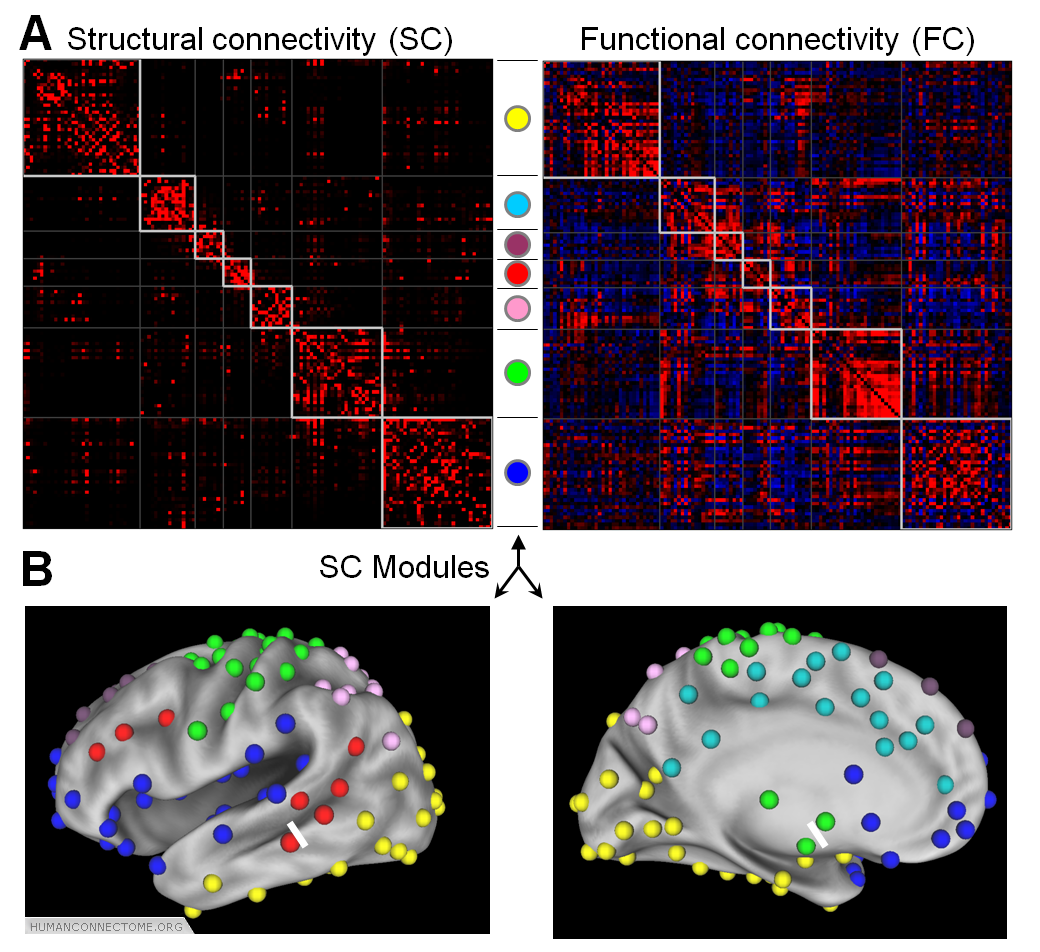
Figure 1: (A) An example of a parcellated connectome, showing structural and functional connectivity matrices obtained from a single cerebral hemisphere. The network contains 136 cortical and subcortical parcels, and network analysis reveals 7 distinct structural modules. (B) Anatomical locations of the modules on the cortical surface.
An important initial step in network analysis involves the definition of nodes and edges. We take nodes to correspond to neuronal elements (e.g. gray matter voxels or brain regions), while edges represent measures of structural or functional association between them derived from HARDI or R-fMRI. We are generating and analyzing connectomes at two levels of resolution. Dense connectomes define connectivity between small volume or surface elements, and are thus closer to the primary connectivity pattern as revealed by imaging, but also computationally more expensive. Parcellated connectomes (Figure 1) provide a more compact description of structural and functional regions and their interconnections. To generate these networks, a parcellation scheme based on connectivity gradients and/or independent component analysis is applied to HARDI and R-fMRI data. The resulting parcels form the nodes of the network, with edges representing their associations.
A variety of network topology measures provide quantitative information about structural and functional brain connectivity. Broadly, three classes of measures each provide complementary perspectives on a network’s local and global organization. Measures of segregation assess the degree to which sets of nodes are more tightly connected, or clustered together, and less connected to other sets of nodes, forming “communities” or modules.
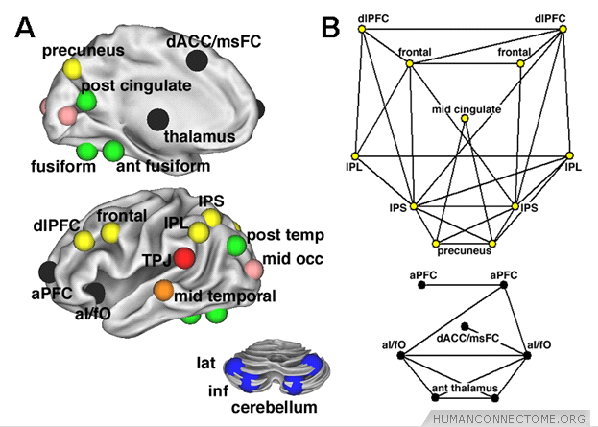
Figure 2: (A) Eight separate components that constitute a graph formed by regions involved in cognitive control, displayed on an inflated surface rendering of the brain. Nodes are color-coded according to separate components (or modules) of the control network. (B) Two-dimensional pseudoanatomical rendering of 2 components, the fronto-parietal component (yellow) and the cingulo-opercular component (black).
Modules often coincide with sets of brain regions that are functionally related, for example, by jointly participating in specific sensory, motor, or cognitive tasks (Figure 2). Measures of integration capture the capacity of the network as a whole to exchange information over short communication paths. A short path length, computed as the average communication distance between all pairs of nodes, indicates that all nodes can be reached from all other nodes via a small number of steps. The related measure of efficiency has been applied in several studies that have compared network organization across individuals or groups.
Finally, measures of centrality allow the identification of nodes or edges that are “centrally positioned” or highly influential within the network. Centrality can be assessed in several different ways, for example by determining how many short communication paths pass through a given node or edge. A highly central node in a brain network participates in a larger fraction of inter-regional interactions, and, consequently, its loss in the course of injury or disease can have a large impact on the functioning of the remaining network. Each network measure provides one or more parameters that are the basis for comparing networks across individuals or groups, and for establishing relationships with genetic and behavioral data.
Throughout the project, members of the HCP consortium will continue to work on the development and testing of state-of-the-art network analysis tools and algorithms. Particularly important is the extraction of clusters or modules from connectome data sets, and extending existing approaches to take into account the spatial embedding of nodes and connections, the existence of significant anti-correlations in functional connectivity, and the full weight structure of the primary data. Additional methods allowing the statistical comparison of networks within and across imaging modalities, and across individual participants, are being developed. Source code for all existing and new network analysis tools will be made available to the community as they are developed.
Further Reading:
- Bullmore E, Sporns O. Complex brain networks: Graph theoretical analysis of structural and functional systems. Nat Rev Neurosci. 2009 Mar;10(3):186-98.
- Dosenbach NU, Fair DA, Cohen AL, Schlaggar BL, Petersen SE. A dual-networks architecture of top-down control. Trends Cogn Sci. 2008 Mar;12(3):99-105.
- Fair DA, Cohen AL, Power JD, Dosenbach NUF, Church JA, et al. Functional brain networks develop from a “local to distributed” organization. PLoS Comput Biol. 2009 May;5(5):e1000381.
- Rubinov M, Sporns O. Complex network measures of brain connectivity: Uses and interpretations. Neuroimage. 2010 Sep;52(3):1059-69.